Daily Speculations
June 1, 2003
A well-meaning reader asks us to opine on Dow
Theory, the collection of technical indicators put forward by Charles Dow in
1899-1902. We eschew the low road of noting that reasons for recent bearish
forecasts based on the theory have been falsified (e.g., the current price
level of stocks being below the 200-day moving average) while new ad hoc reasons
completely consistent with randomness are brought out like the ever-renewing
heads of the hydra. No, we have said enough along those lines, and have taken
our bows. From now on, we take the high road. And we likewise refrain from
playing the part of bull or bear, believing that a down-the-line response may
be helpful in providing a framework and foundation for investors.
Our reader writes that the Dow Theory's current star prognosticator “is a very wealthy man who always has something valuable to say about the market. As Alan Abelson says, he is ‘venerable and perceptive.’” The reader encloses some recent issues of the forecaster’s newsletter that he has sent over the years to others, leading to many new subscriptions. In a recent letter, the forecaster opined that the rise in the Dow from 7500 in mid-March to 9000 in early June is a typical “correction in a bear market, and so far a modest one.” Moreover, “Bear market corrections typically capture one-third to two-thirds of the ground lost since the end of previous bull market, and so far the recovery is very much at the lower part of that range.”
Bear markets, the venerable forecaster says, usually end only when price-earnings ratios are at 5 to 8 times earnings and dividend yields are at 5% or more. Yet in October, P/E ratios were 33 and dividend yields just 1.8%. Thus, he expects the October lows to be breached again in this secular bear market.
“What do you think?” the reader asks.
The most important part about proper technical analysis or, for that matter, any scientific analysis is formulating the question in a proper fashion. A detective, or a little kid searching for knowledge, are good models. Some hallmarks of the proper approach is that the question asked should be simple, precisely defined, capable of falsification or verification, and fruitful if answered correctly.
The biggest problem with the formulation above and all others we have seen by gentlemen of that nature and leaning is that the questions they pose are complex, imprecise, non-falsifiable and unhelpful for market practitioners. In our book, we call it magic or mumbo-jumbo.
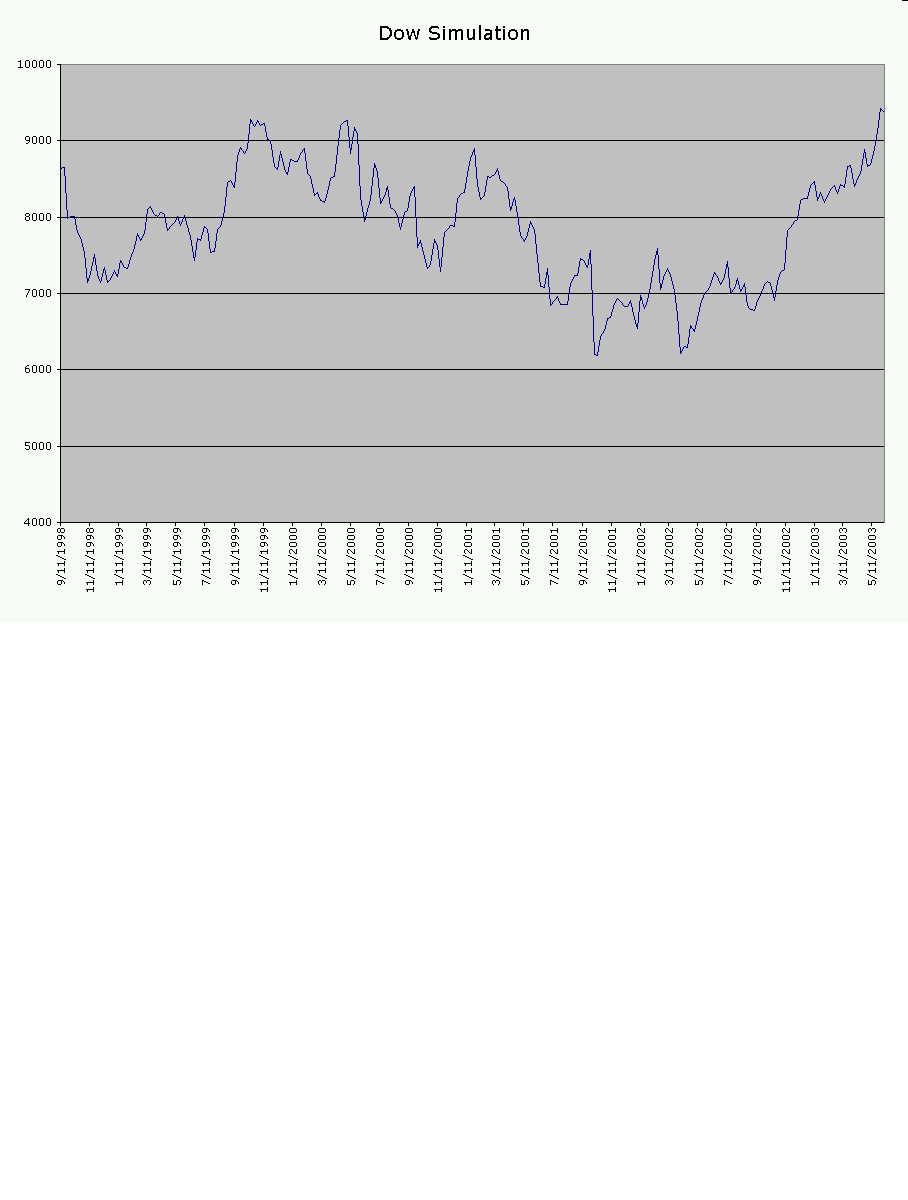
It would take a book to explain everything that is wrong with the questions and point of view exemplified in the forecaster’s remarks. But let’s start with a randomly generated chart of the Dow. We create it by taking the actual weekly changes in the Dow from year-end 1995 to year-end 2002. We then draw from these weekly changes randomly with replacement and construct a chart. Obviously, there is no predictivity to this chart, as the numbers are drawn out of a hat (in this case, a random number generator). The chart was randomly drawn from 100 we constructed. Of course, in such a series there will be many sets of two points separated by a few months, where the point further in time is below the point earlier in time. The point to the right typically is between one-third and two-thirds of the ground lost.
The right point was chosen to be below the left point to start with. And the left point was selected to be above points to its left to start with—i.e., it’s a point where the previous bull market ended.
I defy anyone to tell the difference between the randomly selected chart and the actual chart. Previous efforts by technical analysts to do so, reported in Cootner's book The Random Properties of Stock Market Prices, have shown that technical analysts cannot do so.
Nor would the number of peaks and troughs in a random series like this be capable of any meaningful kind of counting.
As for it necessary for the P/E to be at 5 or 8 and dividend yields at 5% before a secular bull market—whatever that is—can resume, there are even more objections to that. First, interest rates, opportunity cost and discounting rates are some one-third to one-half lower today than in the periods being compared. Second, the demand curve for stocks has changed over the years as income and liquidity have changed. Third, and most important, comparisons of what happened after a few selected bottoms or tops in the past and predictions of the present related thereto are in our experience completely worthless, and we have much experience with such comparisons.
For the scientific reason why such comparisons and predictions and all related fuzzy and self-serving forecasts of this nature are worthless, see the above guidelines on framing questions.
Note: The Dow Theory was first promoted by Charles Dow (the Dow in Dow Jones) in a series of newsletters between 1899 and 1902. Its current main proponent writes: "The stock market is far more difficult today than ever before, mainly because so many analysts, professionals, money managers, arbitrageurs, speculators and serious individuals are involved, and competing for profits (and increasingly, for short term and even intra-day profits). Furthermore, trading has been speeded up and broadened tremendously through the use of computers and the Internet. Finally, the arrival on the scene of derivatives, options, futures, puts, calls, etc., makes the market game bigger, faster, more manipulative, more hazardous -- and far more deceptive than ever before. In the end, however, the 'hidden ingredient' for market success is the practitioner's own instincts or intuition. Market analysis, as so many have observed, is an art, not a science."
The scientific approach is fact-gathering, framing
a testable hypothesis, testing, sharing results with others so they can attempt
to replicate them, and back to the drawing board. It's guaranteed to happen
that analysts with systems not susceptible to this treatment become
"market artists."